
Vulnerabilities: Identifying Security Issues with iSecurity Visualizer BI Tool
Are you using all the capabilities that come with your SEA iSecurity products? Are you aware of the vulnerabilities of the IBM i?
If you have SEA’s iSecurity Firewall (Firewall) or iSecurity Audit (Audit) software, both products come with the built-in iSecurity Visualizer Business Intelligence System (Visualizer BI) at no additional charge to help protect you from the IBM i vulnerabilities. Visualizer BI is a GUI interface that applies business intelligence to your Firewall and Auditing data, enabling you to analyze and graphically display your IBM i security history and issues.
Why you should use Visualizer BI
As shown in figure 1, there are three key benefits to using Visualizer BI to analyze and report on system security, using Firewall and Audit data.
- Forensic research: Visualizer BI can uncover the who, what, and where of an IBM i security breach. It can drill down to what was happening when a security breach occurred and determine which users were accessing the system at that time; what IP address their system access came from; what type of access they were using (i.e., FTP, ODBC, SQL); and what functions, exit points, libraries, and objects they were using. Visualizer BI helps you determine what caused a security breach, and how to improve your security to insure a similar breach doesn’t happen again.
- Investigation: Visualizer BI allows you to evaluate the current state of your IBM i security. It allows you to poll filtered Firewall and Audit security data for specific time periods and then drill down into that data to determine what was happening on your IBM i at the time. Visualizer BI can help you locate key security trends (ex., rogue users who shouldn’t be accessing the system; an uptick in FTP or SQL access; new IP addresses users are signing on from) that may be exposing your system to bad actors or data loss. Firewall and Audit data can also be exported into Microsoft Excel format for further analysis outside Visualizer BI.
- Auditing: Visualizer BI can document IBM i security behavior for management, auditors, regulatory agencies, or other entities, which can help validate your security during audits or after penetration testing. Historical security data can be filtered, analyzed, displayed, and sent out in HTML reports covering specific dates. Auditors can also be authorized to Visualizer BI for their own investigation into what’s happening with your system security.
| Benefit of using Visualizer BI | What it provides |
| Forensic research | Discovers the who, what, and where of an IBM security breach, allowing you to pinpoint the root cause of a breach for remediation and improving security |
| Investigation | Evaluates the current state of your IBM i security and searches for undiscovered security breaches |
| Auditing | Documents system security behavior for management, auditors, and regulatory agencies, which can help validate your security during audits or after penetration testing. |
Figure 1: The three key benefits of using Visualizer BI with iSecurity Firewall and iSecurity Audit
How Visualizer BI works to protect you from IBM i vulnerabilities
Visualizer BI allows you to drill down through the mounds of Audit and Firewall data points to find security issues and vulnerabilities. Using a data mining process, you can first view summary Firewall or Audit activity and then drill down to find specific instances and evidence of any unauthorized incursions.
You start by date filtering Firewall data (remote access to your system) or Audit data (what’s been happening with your security) by the last so many days or for certain dates, using the Visualizer BI screen shown in figure 2.
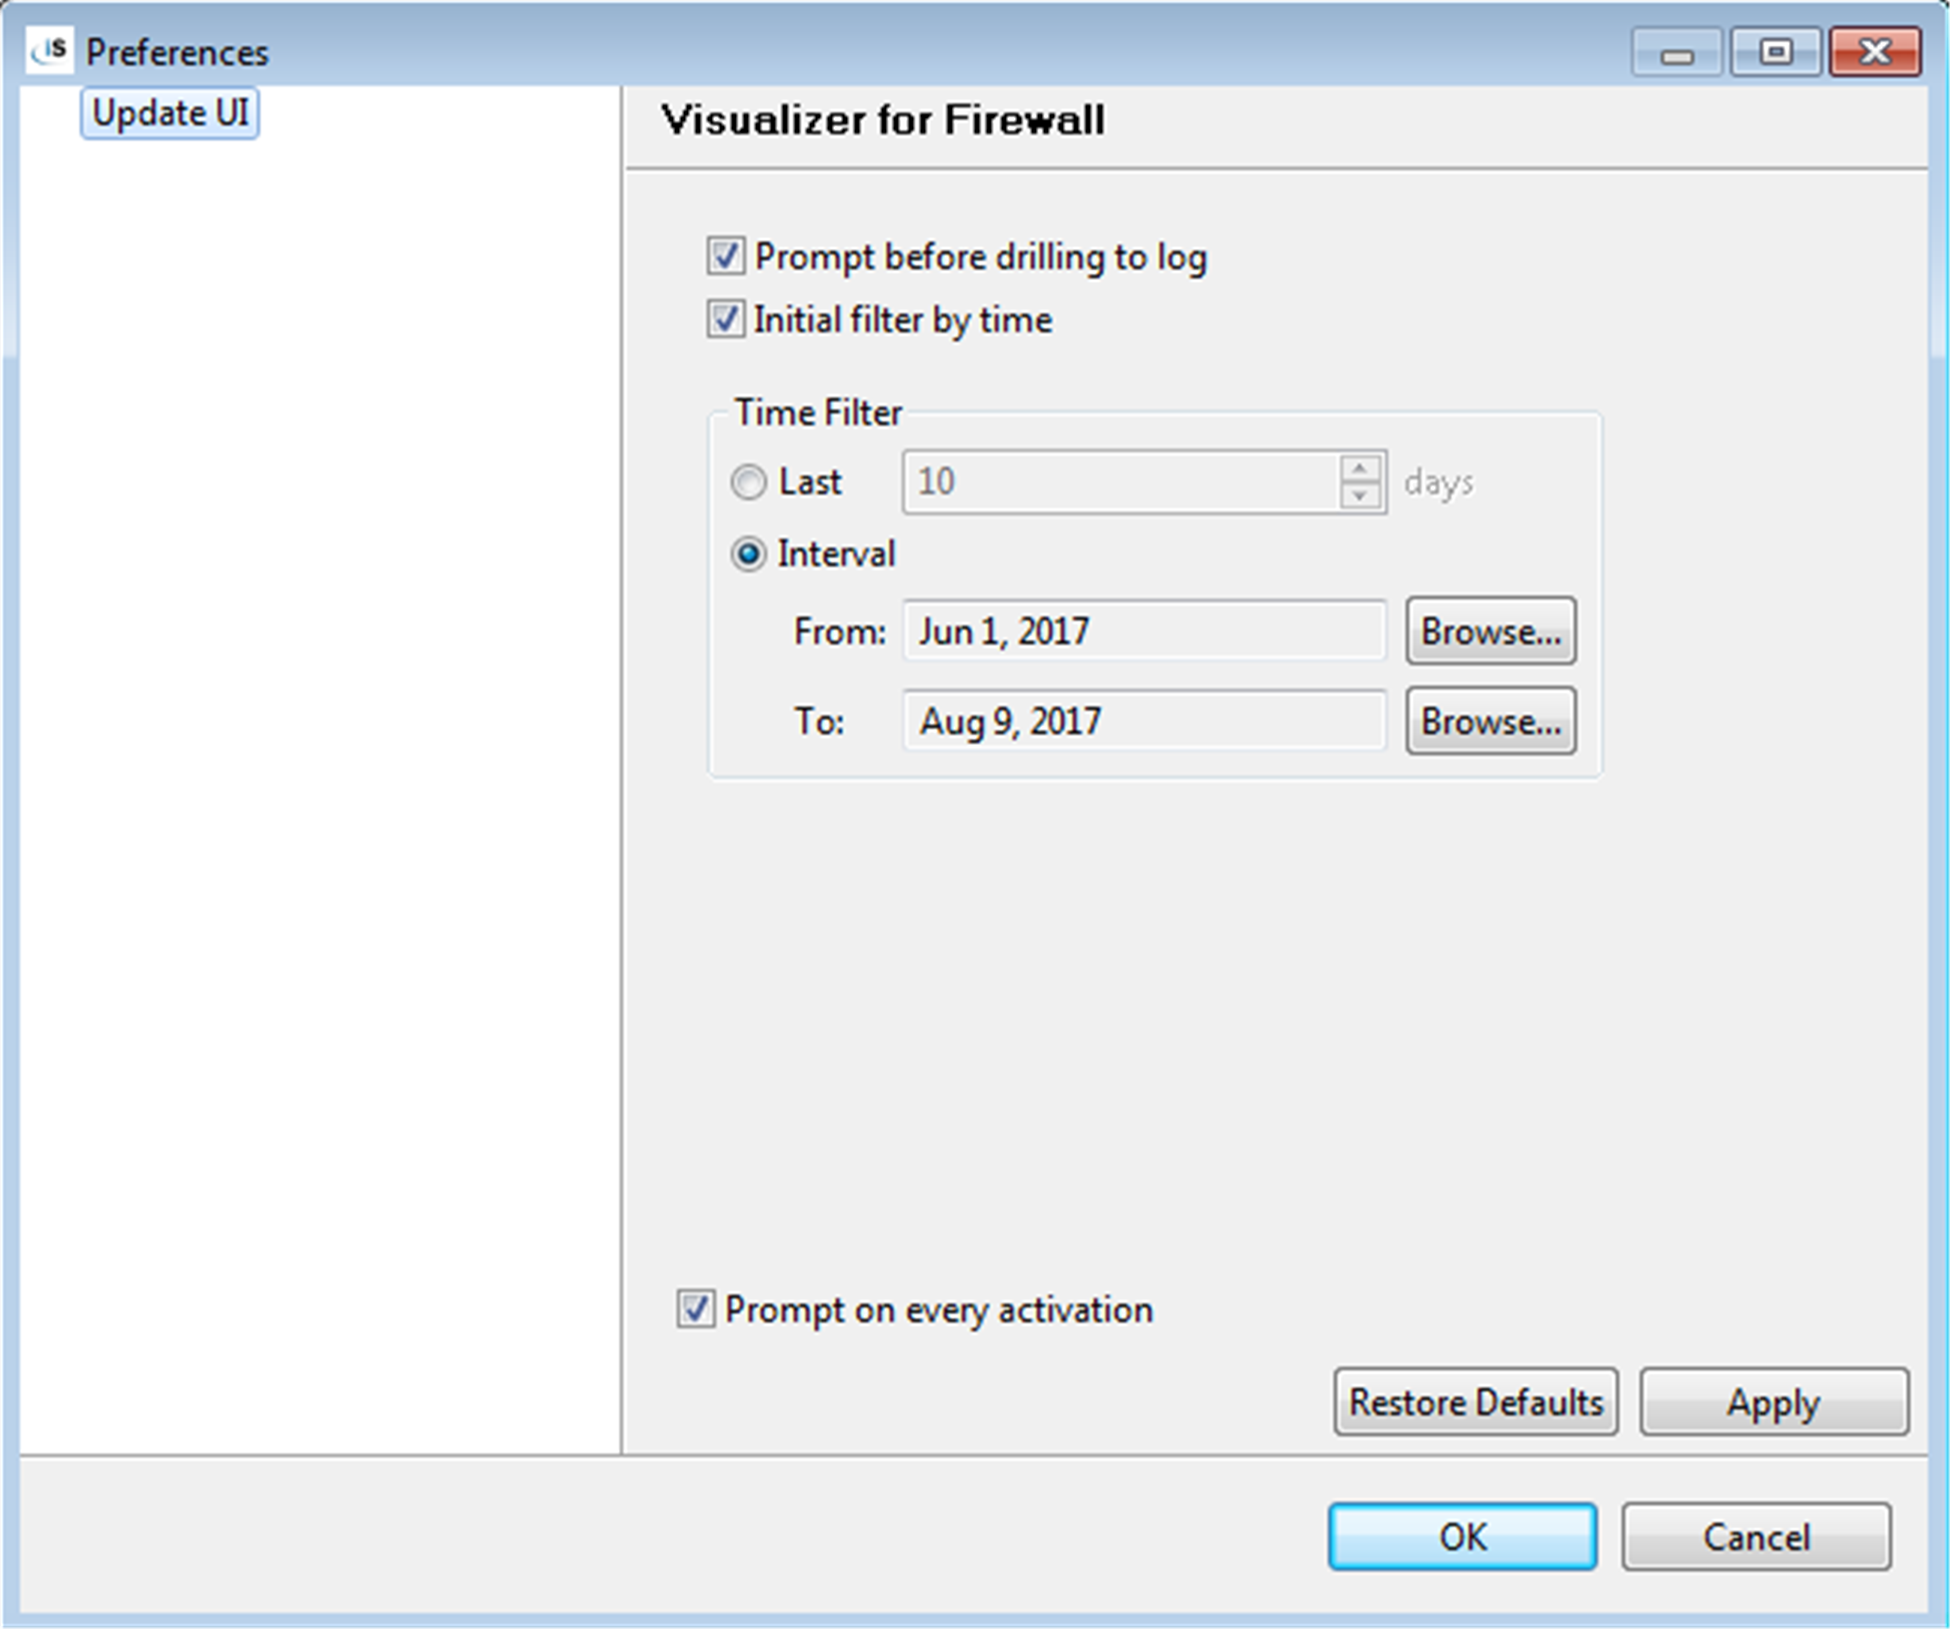
Figure 2: For SEA’s Firewall and Audit product, you can view remote access attempts by date or for the last several days
Your date filter queries SEA’s Firewall and Audit data using the IBM i query function, to produce a columnar table and pie chart showing the number of transactions occurring during that time and which days had the most transactions (figure 3).
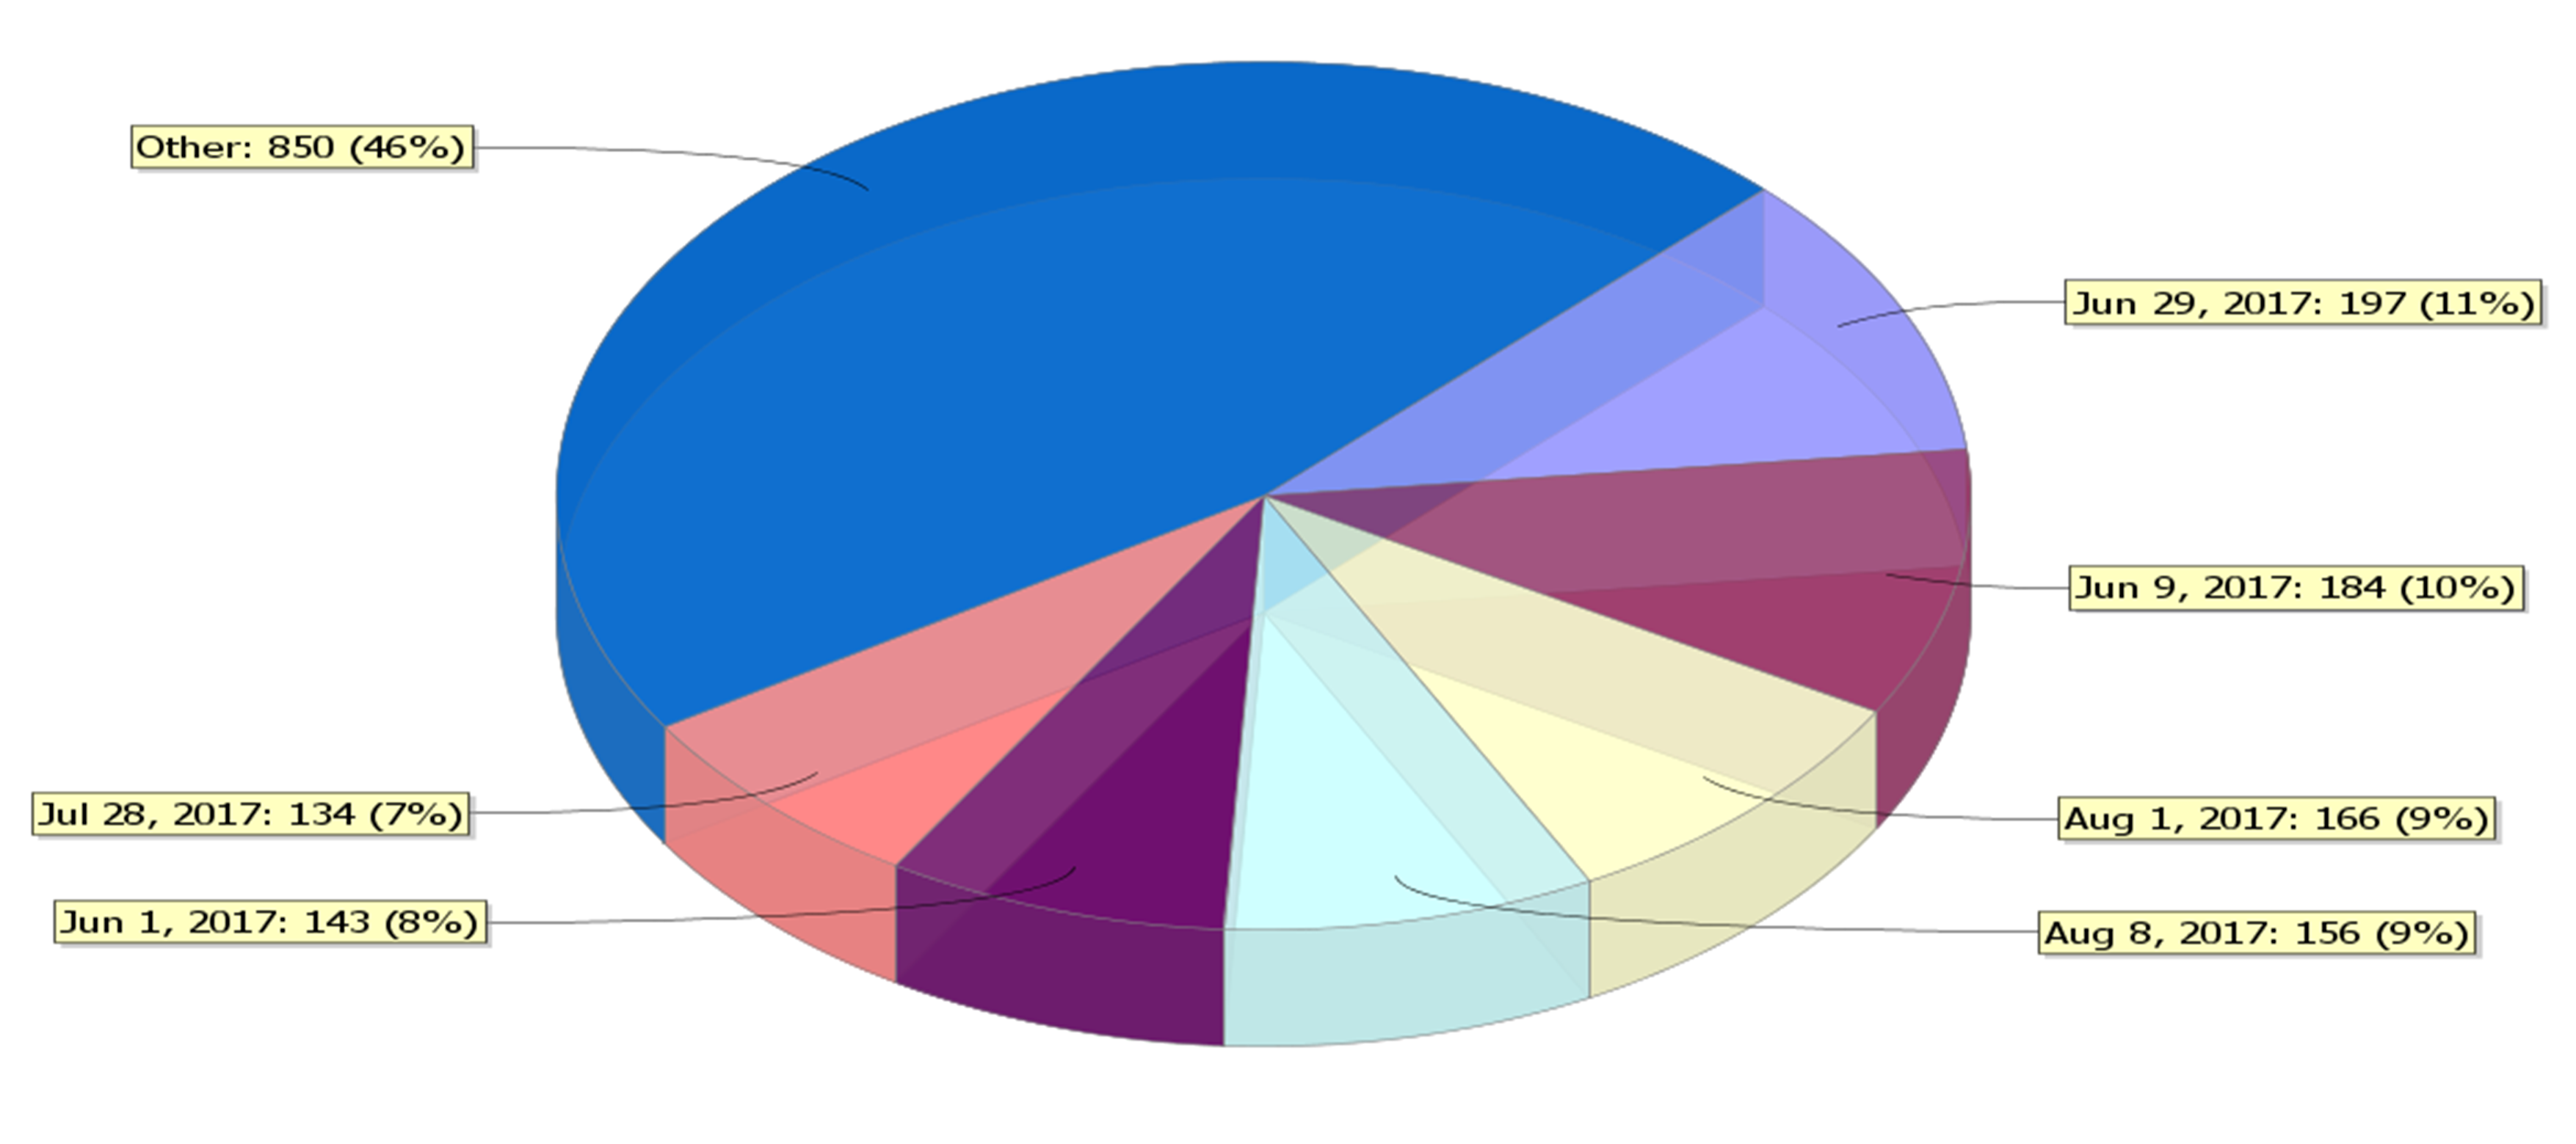
Figure 3: Visualizer BI shows how many transactions occurred on each day and the percentage of all transactions that occurred on each day
The data points on the summary can then be drilled into to look at what happened on the days in question.
By clicking on the tabs at the bottom of this screen (System, user, server, IP, function, library, object, type, result), you can get more information on what was happening during that time period. For example, if I click on the Object tab for this particular set of Firewall data, I might see a screen like figure 4 that shows what files the transactions were accessing over this time. Other tabs show different views of the data including viewing the data by user profile (User), IP address (IP), libraries accessed (Library), and access type (Type).
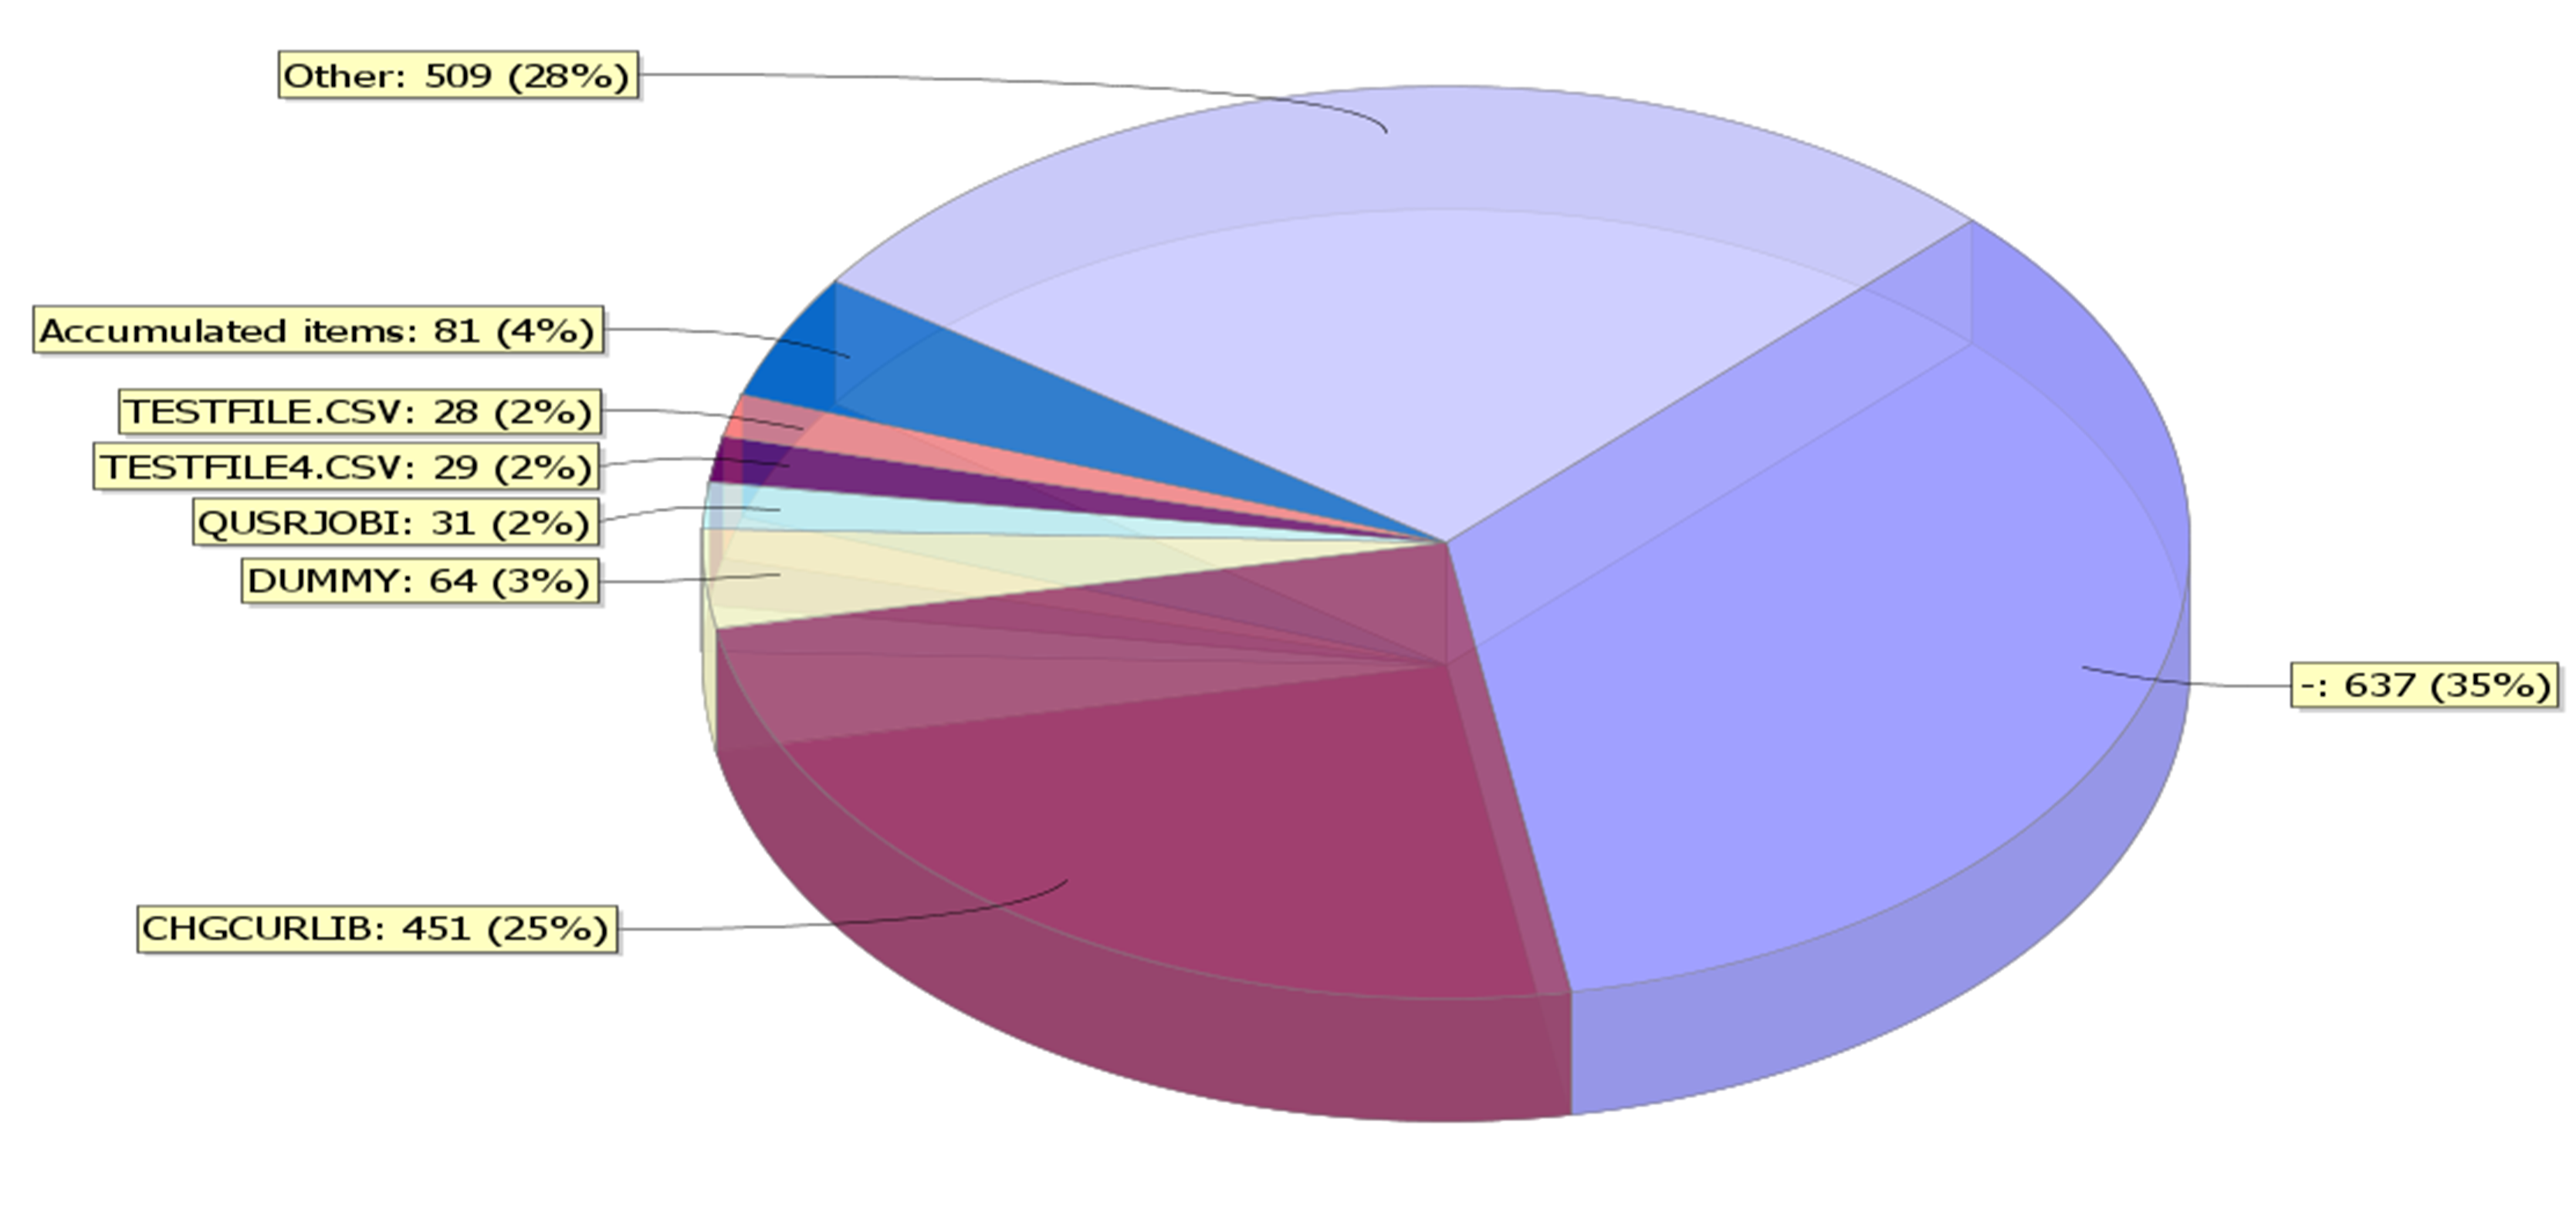
Figure 4: You can view the sorted data by other parameters, such as user profile and IP address. This view displays the data for the filtered period by type of object accessed.
You can drill deeper into the data by modifying the filters to provide finer subsets for each of the data characteristics modified, until you finish investigating the security issues you’re investigating. Once you get your results, you can either save them as an HTML file which can be emailed to management or export the data to Microsoft Excel for further analysis.
Getting started with Visualizer BI
The end result is that with SEA’s iSecurity Firewall and iSecurity Audit packages, Visualizer BI provides built-in business intelligence capabilities that can be used for forensic research for security breaches, investigation of your IBM i security environment, or for management or auditor reporting.
If you already own SEA iSecurity Firewall or iSecurity Audit, you can get started with Visualizer BI as you’ve already purchased this capability along with your package. If you don’t own iSecurity Firewall or iSecurity Audit, feel free to contact us at SEA software for a free demonstration. You’ll be surprised how powerful our Visualizer BI tool can be combined with the firewall and auditing capabilities of our Firewall and Audit products.