
Complex IBM i environments generate a lot of messages that must be monitored to ensure that your systems and applications are functioning as expected. Making sure that nothing falls through the cracks is critical. To that end, here are five things your IBM i Message monitoring solution should have to ensure that you have total visibility of your IBM i environment, while increasing your ability to resolve issues quickly…no matter where you are.
#1: Local & Network views
Many companies have multiple IBM i LPARs on their local IBM Power hardware and they may also have multiple networked Power systems, each with one or more IBM i LPARs. Busy Administrators don’t have time to have to log in to each IBM I LPAR and look through message queues 24 X 7. Sometimes administrators miss critical messages or they don’t see them until it’s too late. Messaging solutions that allow administrators to view events and IBM i messages on local and networked machines using a consolidated message screen, help increase efficiencies and reduces downtime.
#2: Color coded message monitoring
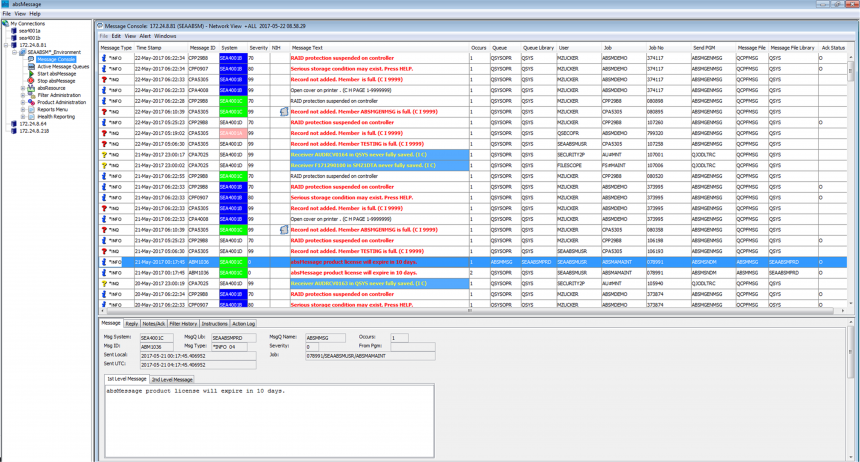
Monitored messages can also be color coded on a consolidated message screen to identify which messages need immediate attention. As shown in the consolidated message screen from our absMessage product in figure 1, messages from a specific system can be highlighted with a specific color representing that system and message severities for informational messages, inquiry, and critical messages can also be color coded in green, yellow, and red stoplight colors AS400 Color Coded System Messages.
#3: Notification, escalation & scripting
An IBM i Message Monitoring solution eliminates the need for Administrators to look for problems. Instead, the IT department can be immediately notified of potential issues by text, email or other methods, allowing them to immediately investigate further. Immediate notification saves time which could be better spent on projects that can help improve the business.
Even better than being notified of an issue when it happens, is being able to automate the response with scripting, without human intervention. Scripting allows the system to automatically issue responses for known problems. If an issue isn’t picked up and resolved within a set time period or the scripted responses don’t work, the message can be escalated to the next responder in a call tree. This frees up time, but even better, the system knows exactly how to handle each type of message. People come and go, but the knowledge on how to solve problems stays within the company in your monitoring software.
4: Working with messages via 5250 green screen, mobile devices, & Web consoles
Many administrators really enjoy using the green screen. It’s like home, familiar and comfortable. Sure, the green screen lacks the sex appeal that the web can offer, but it is efficient.
There are also those people who hate the green screen. They find 5250 screens to be old fashioned and they prefer the point and click features they get through a Web interface to their system. When these people sit in front of a green screen, they feel like they stepped into a time warp. They prefer a Web interface for message monitoring and response.
And let’s face it, we live in a mobile world. We are connected to our mobile devices. Your message and resource monitoring should be no different. Being able to reply to messages from a mobile device enables your operators to be more responsive and not always have to log on to their laptop, connect to the system and reply to the message. Mobile device response is efficient, effective, and immediate for responding to IBM i error messages.
An IBM i messaging product that works with all interfaces for message response (5250 green screen, a Web console, and mobile devices) is a huge benefit to companies. Having a single solution is critical to a successful messaging system rollout.
#5 SNMP and SIEM Support
Many companies have invested in System Information and Event Management (SIEM) solutions like IBM Tivoli, HP Openview and SCOM. These solutions are critical in the data center. Having IBM i system and event information represented in SIEM analysis is important to have a full picture of an organization’s enterprise network. It’s important for a messaging solution to integrate with any existing SIEM solution you may already have in place, (or may get in the future). SNMP is one of the easiest ways to achieve this integration, so be sure that the solution you consider has the ability to send SNMP traps to SIEM software.
When looking for an IBM i Message and Resource Monitoring package such as our absMessage software, be sure to look for these features.