
Imagine you have your own website for IBM i message and resource monitoring. Imagine that Web site provides real-time dashboard and console views of all your IBM i systems, showing the status of each system and any critical IBM i situations, including:
- High CPU utilization
- High DASD utilization
- Job behavior
- Hardware errors
- Application errors
- Security events
- Current status of system issues, who’s handling them, remediation events, and the latest updates on each issue
Now imagine you can graphically review system information from either a local view (showing a single IBM i system), a network view (showing all the IBM i systems you’re monitoring), or a service point view (showing all the monitored i systems belonging to a specific client, organization, or division).
If you’re an SEA absMessage customer, you can stop imagining and retrieve all this information and more from a Web browser by using absMessage Web console.
What’s absMessage Web console?
absMessage Web Console is a Web User Interface (WUI) for SEA’s absMessage resource and monitoring software for the IBM i. Web console allows anyone on your network to retrieve up-to-date monitoring information for all systems on your network—including Service Desk personnel, IBM i ops staff, IT responders, managers, or other administrative personnel—without installing any software on your user’s devices. All they need is a Web browser.
A dashboard view of your IBM i systems
Web Console provides a custom view of all your IBM i systems in either a dashboard or console view. Shown in figure one, the dashboard view can show your current CPU and DASD utilization for the IBM I systems you’re monitoring. You can see this view in either a dial, bar graph, or log perspective. The dashboard displays information for a single IBM i system (local) or your entire network. You can also subset your IBM i systems and show the CPU and DASD utilization information for selected groups of IBM i systems you manage (service points).
The dashboard view allows you to drill into either CPU or DASD utilization and view the monitored data for times when CPU or DASD exceeded console thresholds or a percentage utilization.
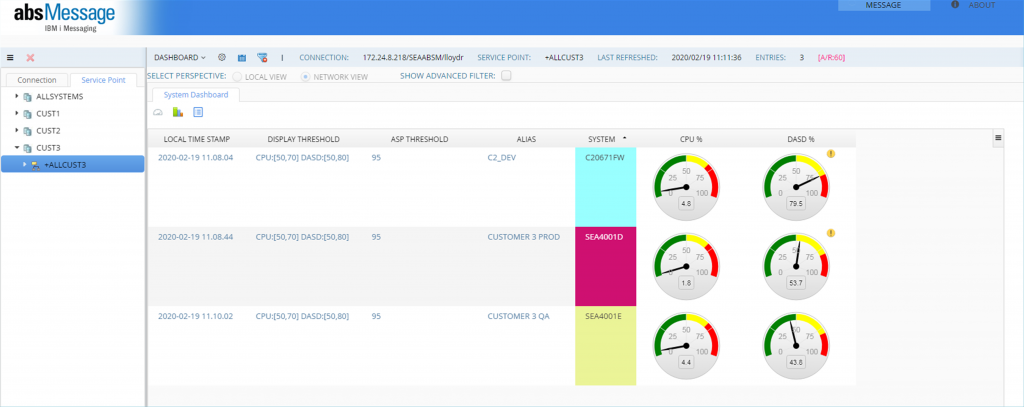
Figure 1: The dashboard view of absMessage’s Web Console
A console view of your IBM i Systems
Web Console also allows you to view your system’s monitored activity in console mode (figure 2).
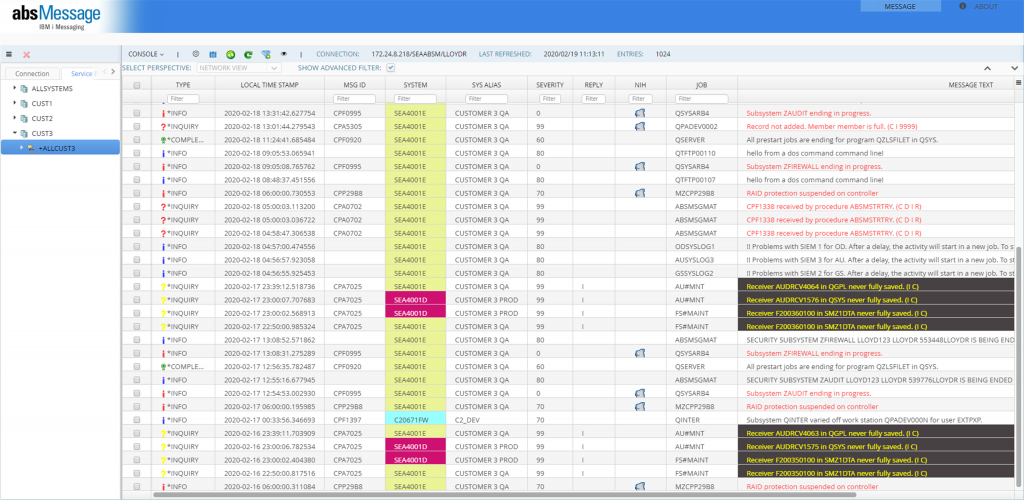
Figure 2: The console view of absMessage Web Console
Console mode provides an overview of all the alerts, recent messages, and replies needed either for individual systems, your IBM i networked systems, or service points. absMessage can also configure and show aliases for system names so you can assign meaningful names to your IBM i systems rather than the serial number name that was assigned to your system. Your IBM i monitoring personnel can use Web console to view the following critical system information.
- The most recent message displayed on the system
- Whether there are any messages waiting for a reply; the last message ID, message severity and text description; whether the reply was automated; what job generated the message; and if any replies have been entered for that message
- If responders are working with an issue, they can enter notes on the status of that issue. They can also mark a monitored issue as being worked on, so that other responders know that the issue is already being handled.
- Color coding for each system so that the viewer immediately knows when a problem occurs on the system. Systems requiring action are colored red and the systems running without problems are colored blue.
- A special absMessage filter can force informational messages to display as inquiry messages that need an operator response. This can draw the operator’s attention to unusual situations (such as disk exceeding a threshold usage percentage) that may not need immediate attention, but needs someone to look at.
The console view can be powerful for giving IT ops personnel and responders immediate information about a system status.
Combining Web Console with other absMessage functions
Web Console is a valuable addition to absMessage. It works well with other absMessage features, such as monitoring, automatic notification of system issues, automatic responder notification when a problem occurs, problem escalation, automatic replies and remediation, and manual replies to system messages.
With Web Console, your IBM i monitoring needs can be met with any interface you choose. You can monitor and respond to IBM i messaging situations through an IBM i 5250 green screen, our Windows PC and laptop monitoring application, or through a Web browser using the Web Console feature. Whatever your preference (5250, PC app, or Web app), absMessage can provide an interface for you to work with IBM i message monitoring.